Top football clubs are different to other businesses. Whereas most companies exist to generate wealth for their shareholders, football clubs must balance this against the pursuit of trophies. Of course, the two aims are linked, or can be: mountains of silverware will increase a club’s popularity, tending to make it more valuable and, hence, to enable its owners, should they so choose, to sell it at a profit.
But if a club’s owner is a life-long fan, or if the glory game is judged more important than the profits game for other reasons, it can actually be rational for a club to splash the cash to the maximum extent possible or necessary without endangering the owner’s long-term solvency.
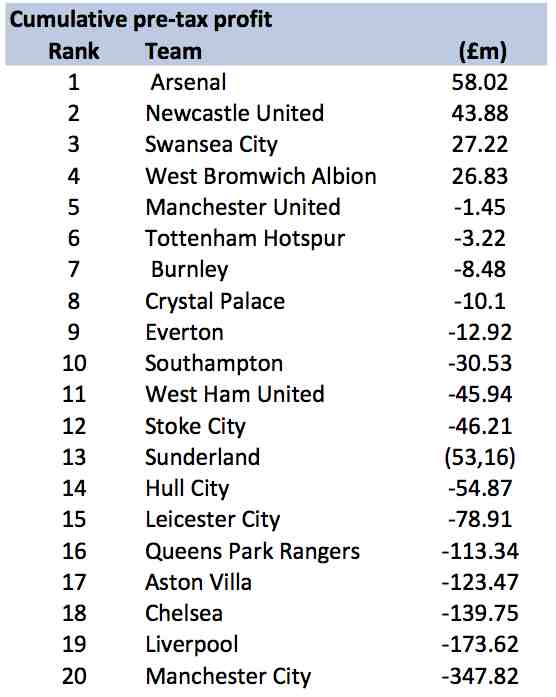
In this context, and with the new European season fast approaching, the table below, ranking the 20 2014-15 English Premier League clubs by their profits performance over a number of seasons makes fascinating reading.
Using data compiled and published by professional services firm Deloitte in successive annual reviews of football finance, I have aggregated each club’s pre-tax profit (or loss) over the seven seasons to 2012-13. This is the result:
*Swansea and Southampton figures based on six seasons’ data and Crystal Palace on five seasons.
Some things are immediately apparent:
With only four clubs managing a profit, and aggregate losses of more than £2.25 billion attributable to the 20 clubs in total, the glory game has continued to have very much the upper hand in recent seasons.
Indeed, to some extent you could argue that there is an inverse relationship between the glory game and the profits game, given that the bottom three clubs in this table were the top three in last season’s Premier League title race.
The placings also serve to illustrate the potential tension between financial and footballing performance, particularly for diehard fans. The top of this profits table is dominated by the North London duo of Arsenal and Spurs, who managed one trophy between them – a League Cup – over the seven seasons represented.
How many fans would have traded the £250 million in profits accumulated by the clubs in this period for a few more players and, perhaps, a less meagre haul of trophies?
Also well worthy of comment, however, is the elevated position on this table of Burnley, who have managed to return to the top-flight without running up anything like the losses of the other two newly-promoted clubs, Leicester and QPR.
I thought it would also be interesting to attempt to inject a rating for footballing performance into this purely financial listing. So I allotted £1 million in value to every Premiership point secured by the clubs over the seven seasons and added that to the total. This is what difference it made:

Not surprisingly, this bears a bit more of a resemblance to the Premier League table one might expect to see next May, except that Manchester City are still last, so heavily has the club spent in recent seasons in a successful effort to bring silverware to the sky blue side of town.
Manchester United’s unrivalled haul of Premier League points has seen them power up the table, though they remain below the North London duo, far below in Arsenal’s case.
Scrutinising these figures, you might conclude that the Gunners – the only club to record a pre-tax profit in all seven of the seasons covered by this exercise – had achieved the perfect model for consistent financial and footballing success.
Fans, though, would probably look at the empty trophy cabinet, reflect that there is precious little glory in finishing third or fourth in the Premier League and wish they had invested at least £200 million more in players.
Their patience was, of course, finally rewarded with victory in last season’s FA Cup; it will be interesting to see if the club also reports yet another pre-tax profit.
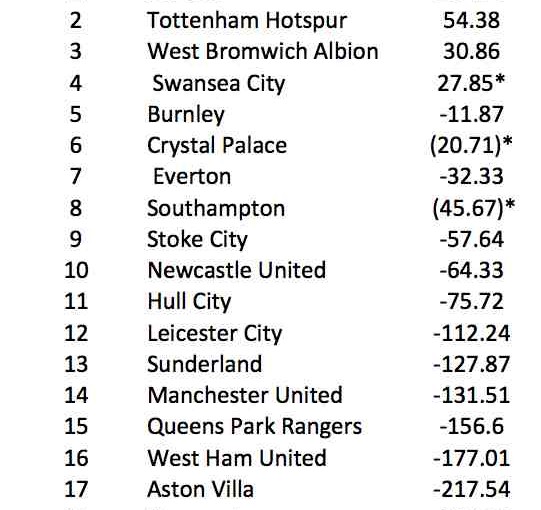
I wondered how the profit table would change if one telescoped the time-frame to cover just three seasons up to and including 2012-13. This was the result:

The changes are remarkably modest, all things considered, and the aggregate loss of the 20 clubs is still more than £1 billion.
Newcastle United, the only club along with Arsenal and West Brom to report a pre-tax profit in each of the three seasons, has surged up the table. So has Manchester United, which all but broke even at the pre-tax level over the period.
But the top three clubs in last season’s Premier League table are the ones that reported the biggest losses over the three previous seasons. The glory game is still winning.
David Owen worked for 20 years for the Financial Times in the United States, Canada, France and the UK. He ended his FT career as sports editor after the 2006 World Cup and is now freelancing, including covering the 2008 Beijing Olympics, the 2010 World Cup and London 2012. Owen’s Twitter feed can be accessed at www.twitter.com/dodo938.

